Intro–Area-Chart-
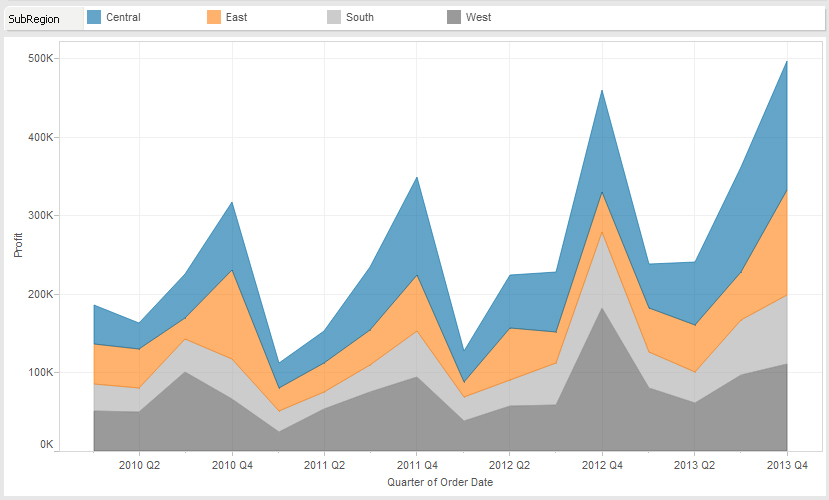 test ## Quick Facts - Area charts are typically used to represent accumulated totals over time. - An area chart is a line chart where the area between the line and the axis are shaded with a color.** - Area charts are a conventional way to display stacked lines. Derived from: Area Charts: Sales by Category; Sales by Segment. (n.d.). Tableau. Retrieved October 29, 2022, from [title] (https://www.tableau.com/learn/tutorials/on-demand/getting-started-part6?playlist=474706)